Statistical Process Control (SPC)
CONCEPT INTRODUCTION
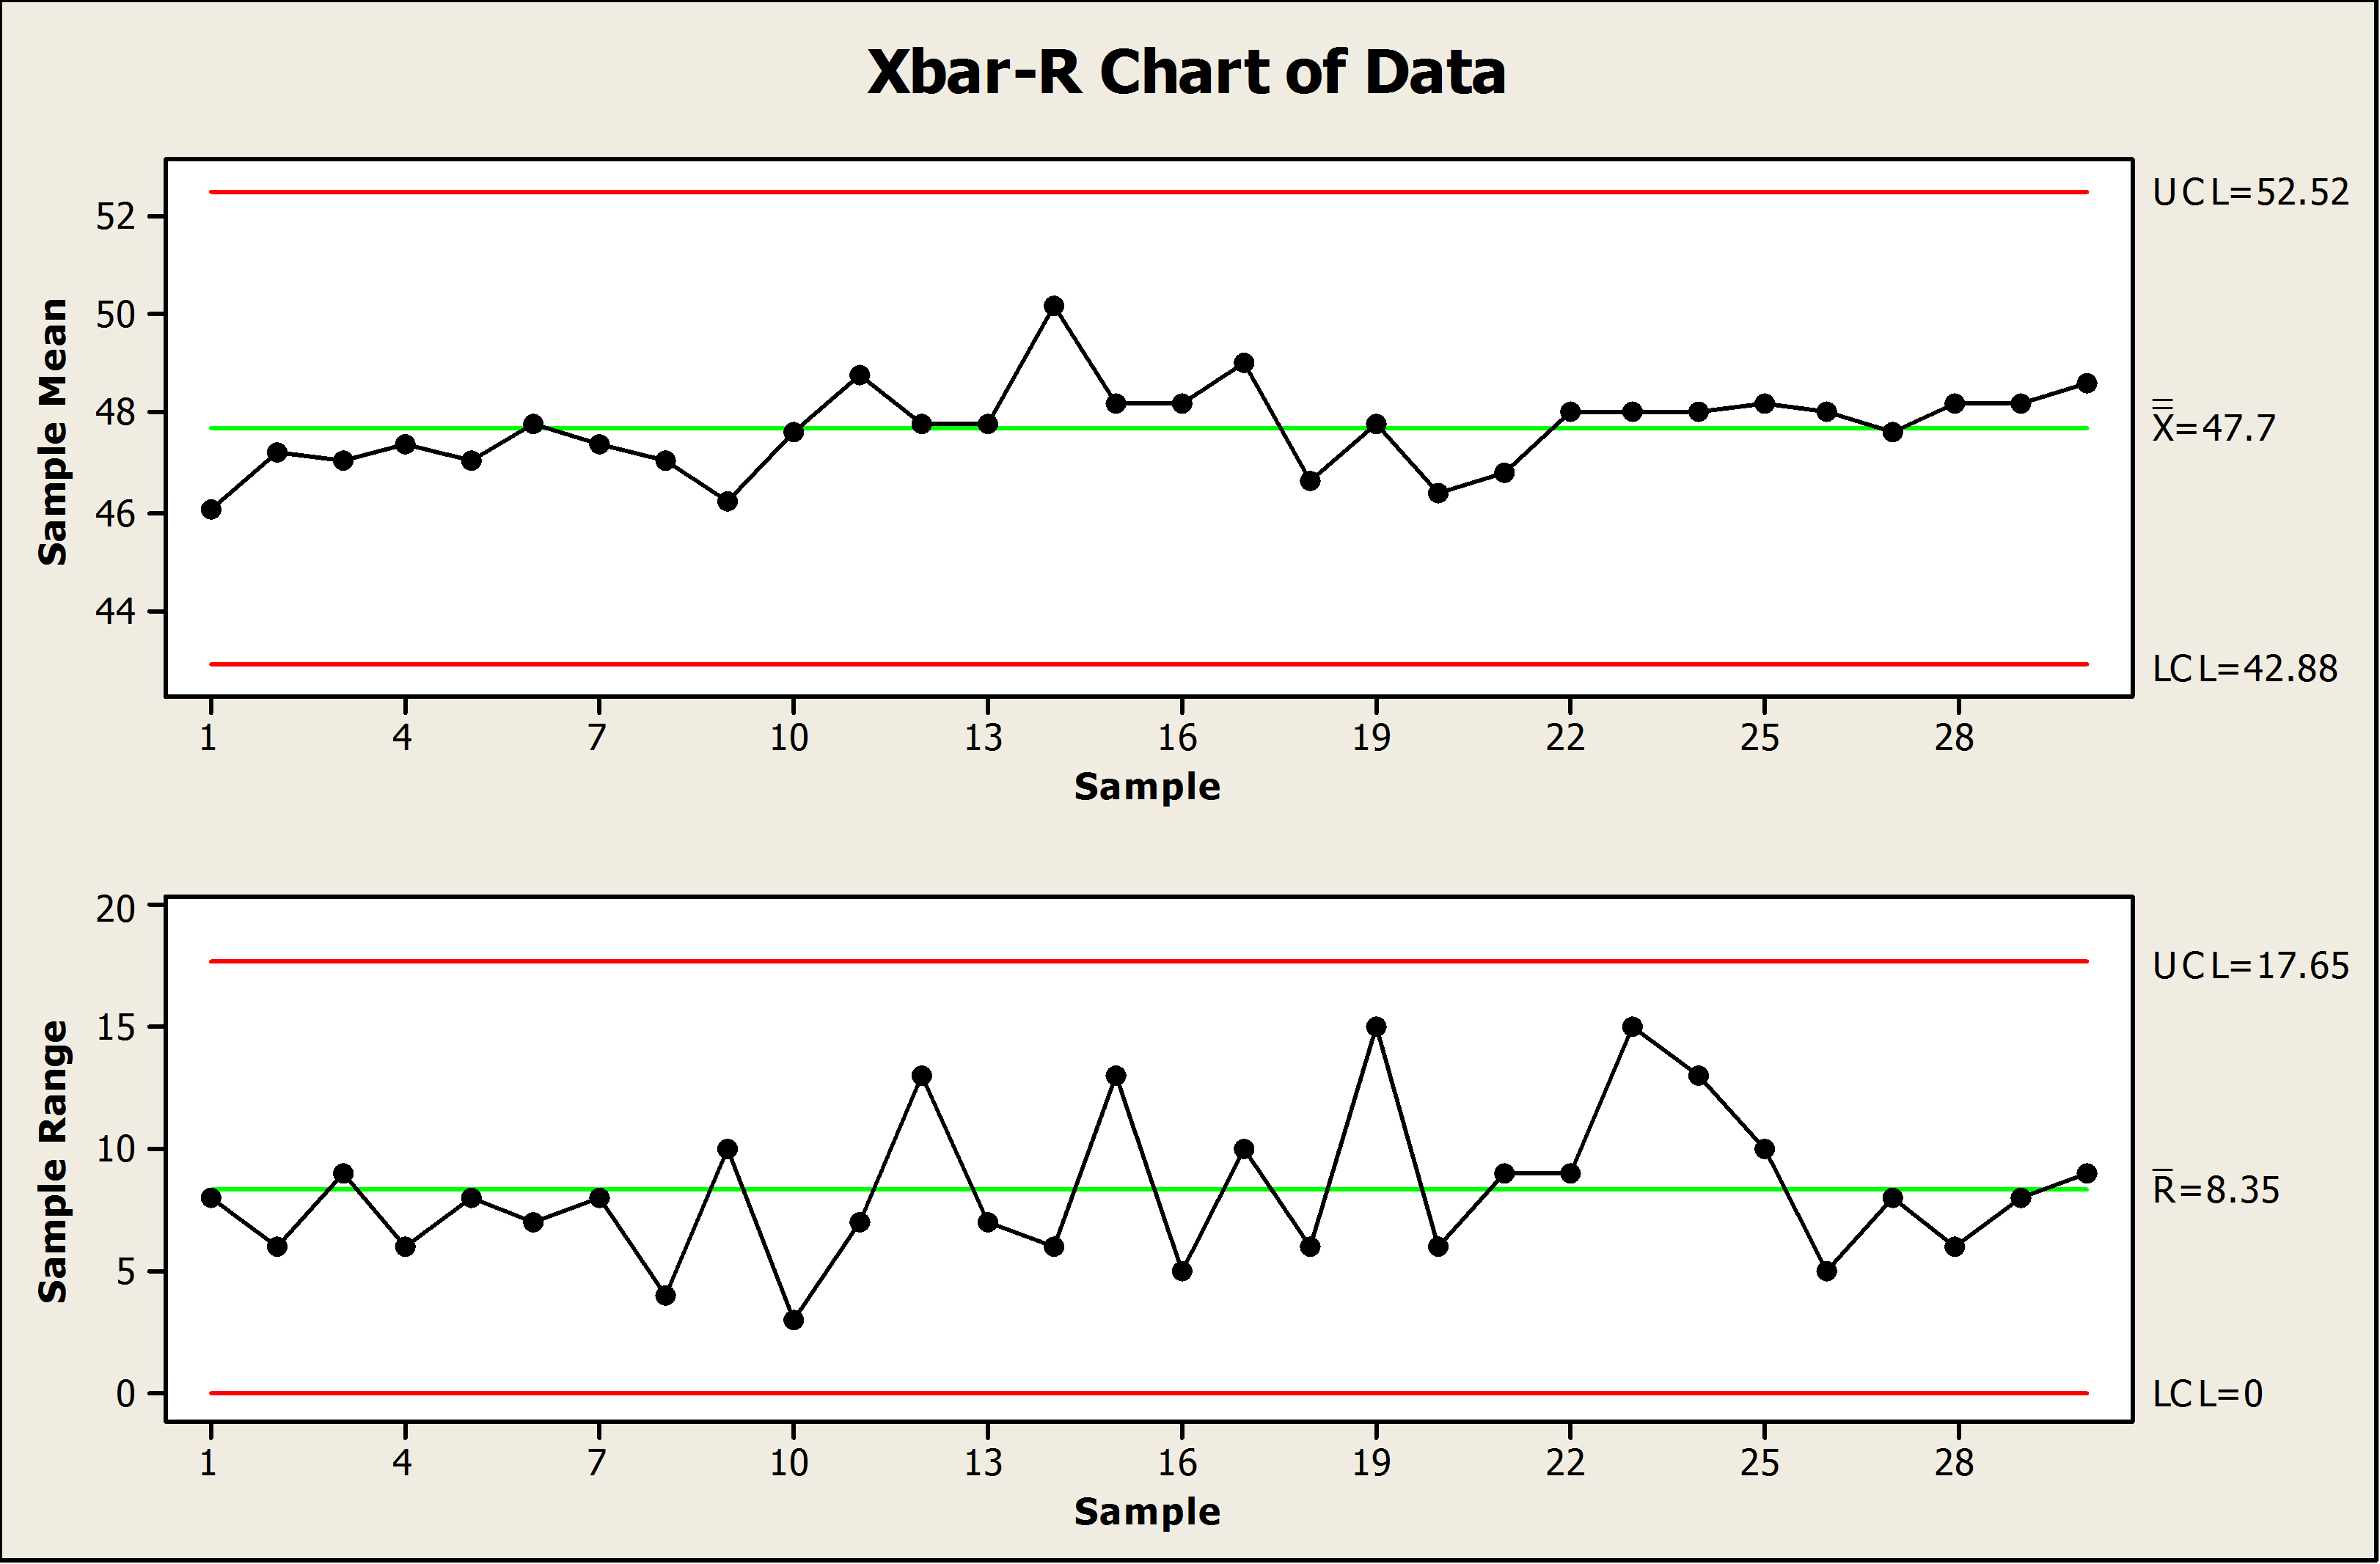
With Statistical Process Control, the name of the game is stabilizing a process by correcting special causes and improving it by targetting common causes with process or method changes. The goal is generally to avoid non-conformances and hence scrap and rework, meet specifications, and ensure the customer receives what they want. This is traditionally observed with control charts, histograms, and the respective statistics to monitor distributions, averages, and variances against their limits, capability, stability, and the Western Electric rules.
EDUCATION
Brief: As elaborated on further in this article, I have been educated on the subject by the Institute of Industrial Engineers (IIE) in their Six Sigma Green Belt Certification course, as well as by the University of Waterloo in their Quality Management and Control course, and lastly by Rockwell Automation Inc. With IIE, I learned about SPC and how to create control charts by hand. With the University, I learned about SPC and how to perform it using Excel. Lastly, with Rockwell, I learned about the concept and how to create even more control charts using Minitab.
IIE Green Belt-SPC by hand
During a Six Sigma Green Belt Certification class run by the Institue of Industrial Engineers, I learned how to manually create xbar-R (average and range) and I-MR (individuals and moving range) control charts. We learned about the idea of bringing a process into stability versus control, and from there maintaining and improving processes using control charts. We learned about special and common causes, how they differ and relate using control charts, histograms, and statistics. We covered out-of-control checks including comparing shape to the normal curve and checking against the Western Electric Rules. Also covered was checking process capability (ability to conform to customer specifications), both visually with histograms and limits, and mathematically with the statistics.
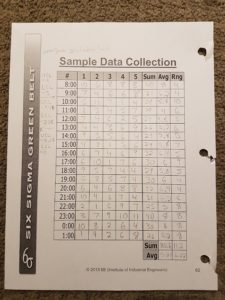
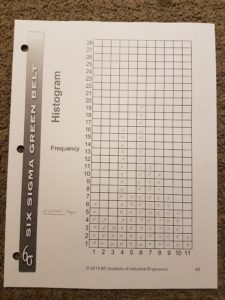
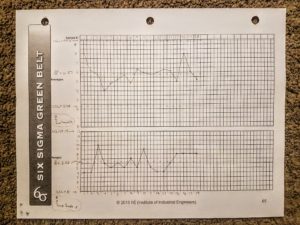
Manual Creation of Control Charts for IIE Course
Class-Using Excel
While at The University of Waterloo, I enrolled in a class where I was introduced to a large collection of quality philosophies, methodologies, and tools. Among these was a large set of topics on Statistical Process Control including most, if not all, of what was learned during the Six Sigma course I took. Rather than creating the control charts manually, we used Excel. In addition to the xbar-R and I-MR charts, we learned about attribute charts like p, np, u and c charts, and variable charts like median and xbar-S charts.
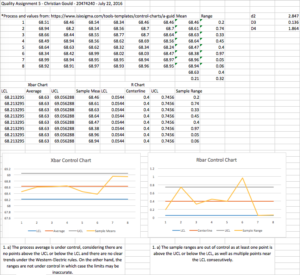 UW Quality Management and Control Class Excel Control Chart
Rockwell-Using Minitab
While at Rockwell Automation Inc., I took courses that covered statistical process control, focusing on how to implement it using Minitab. This was mainly a refresher given my education from IIE and the university courses I took, but I did learn a great deal about executing SPC using Minitab.

Example Minitab Control Charts
EXPERIENCE
Brief: My experience, which is also explained in further depth later in this post, consists of experience from my co-ops at Rockwell. I used it traditionally with a torque tool project and also used it more creatively with a 9-Panel performance metric.
Rockwell-Torque Tool
While at Rockwell I implemented a $200,000 torque tool system (similar to the one pictured below) to control and reduce loose wire defects in the low-voltage tubs area for medium-voltage drives (much like the tub shown below). To judge the effectiveness of this tool, SPC was used with a variety of operators, parts, and tool settings. The accuracy and precision were monitored and found to be well within the specification limits for each, and as a result, there were no observed loose wire defects found in inspection or by the customer after implementation. This cut 7% of the total defects per unit; although, it is important to note that the control phase was relatively short. The data was recorded using the tool’s sensors and databases, downloaded via USB and the provided software, and analyzed using Minitab.
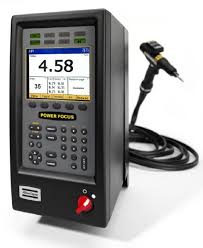
Atlas Copco Power Focus (Torque Tool)
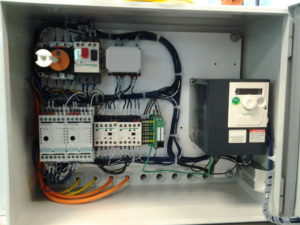
Example Control Wiring Panel/Tub
Rockwell-CI Ideas Implemented
Also during my term at Rockwell, the Plant Manager gave me the opportunity to work with managers on analyzing, and if needed, redefining the 9-Panel metric for the number of Continuous Improvement Ideas Implemented. This initiative arose as the target seemed unbalanced and as such, difficult to achieve for some departments. Based on numbers of people in the department, historic ability to achieve their goal, and insights from each department manager, I developed a new chart. By comparing the previously mentioned factors and the control limits, a set of three different achievement levels were developed indicating the performance level for this metric. Any point below the lowest limit indicated attention was needed to raise performance, a point above the highest line indicated high performance and suggests ideas might be illegitimate or targets can be increased, and lastly data points anywhere in between indicate expected performance. Similar to control charts, if any point was outside of these limits or is flagged by Western Electric Rules, investigation needs to be done as to the implications and legitimacy of the results. Each of the managers found the new levels set to be reasonable and they were integrated into the 9-Panel.